
SAMSI Blog: Where are you Gonna go when the Volcano blow?
This article provided by Bruce Pitman , Professor in the Department of Materials Design and Innovation School of Engineering and Applied Science at the University of Buffalo . It highlights how the practice of statistics is used to mitigate risk hazards during natural disasters, such as a volcanic eruption.
One of the major hazards of volcanic activity is inundation by debris flows, block and ash flows, and hot pyroclastic flows. These can run out many kilometers, travelling at speeds of 50 m/sec or more. A challenge for volcanology is to predict the chances of a flow inundating a specific location – that is, what areas are at risk of suffering a hazardous flow event.
A group of scientists from geology, engineering, mathematics, and statistics has been studying this problem for more than 15 years . Several of the scientists came together during the 2006-2007 SAMSI program on “Computer Models”, and have been collaborating ever since.
After lying dormant for more than 300 years, the Soufriere Hills Volcano on the island of Montserrat began an eruptive phase in 1996. Hundreds of mass flows have occurred during the last 17 years, ranging in size from O(104) m3 of material
to 200 × 106 m3 of material. Several of the largest of these flows have caused tremendous damage to population centers on the island, to the extent that today more than half the island has been evacuated.
Using mathematics to derive model equations describing the flowing mass, and the sophisticated computer solver TITAN2D, scientists can simulate mass flows at Soufriere Hills, assuming certain input parameters. To calibrate the effort, each computer simulation currently takes about 20-60 minutes on a 16-processor parallel cluster.
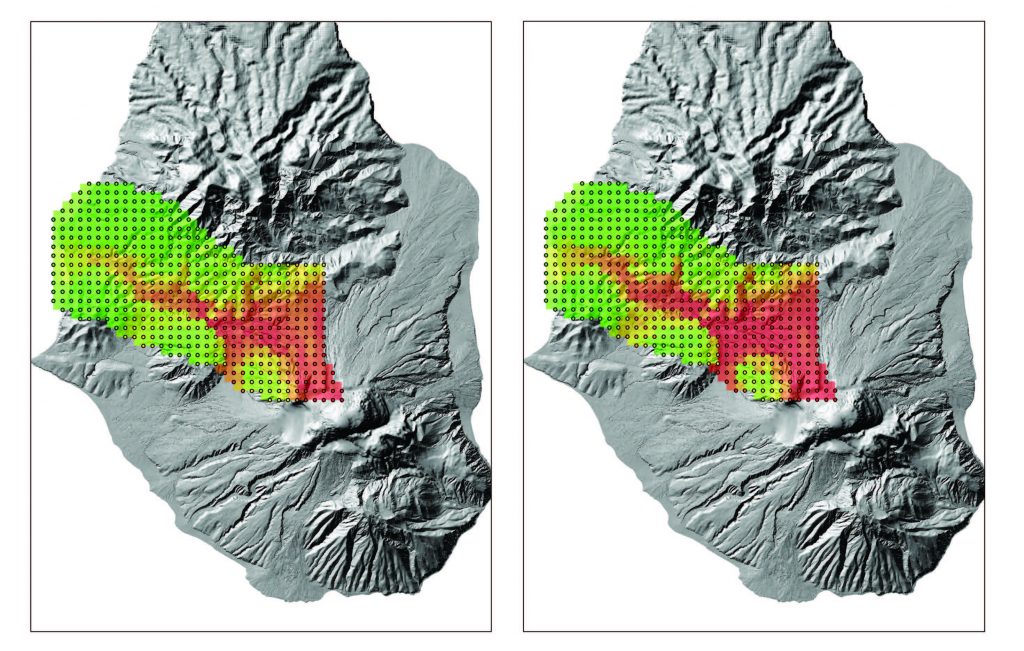
This figure shows contour from flow thickness computations, showing safe and hazardous zones along the Belham valley on Montserrat.
By combining flow data and expert opinion, one can develop a probabilistic model of the severity and frequency of flow events. The naïve approximation to assessing the hazard probability, namely sampling this distribution to generate inputs and running those inputs through the simulator to estimate the percentage of these
runs that ‘hit’ that location, is not feasible because of the rarity of catastrophic events and the expense in running the simulator. Furthermore, this approach ties the expensive simulator runs to a specific probabilistic model which may prove antiquated as new data and information become available.
Our group introduced a new twist: a statistical emulator — a computationally cheap response surface approximating the output of simulations — is constructed, based on carefully chosen computer model runs. The speed of the emulator then allows us to ‘solve the inverse problem’: determine regions of inputs values (characteristics of the flow) which result in a catastrophic event. Then the probability that a catastrophic event will occur at a particular location can be quickly calculated under any probability distribution of inputs. With a careful arrangement of computer simulations and emulator constructions, we can calculate the probability of a catastrophe at many locations simultaneously, producing a hazard map like that shown in the figure. This map shows the hazard regions near the Belham valley, under four different, potential eruption scenarios. Civil protection officials have set “trigger points”, sites at which flows of a certain thickness initiate evacuation of particular neighborhoods. Our hazard maps can provide additional information to these officials, and help refine the trigger and evacuation workflow.