
When The Volcano Blows
“I don’t know where I’m gonna go when the volcano blows”. So wrote Jimmy Buffet. The more important challenge for volcanologists, however, is to determine “When should we go before the volcano blows!” Tackling this challenge was a principal focus of a group¹ of statisticians, mathematicians and volcanologists at SAMSI last year.
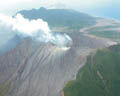 The Soufriere Hills Volcano (right, April 2005) on the island of Montserrat had been dormant for some 300-500 years before its current eruption cycle began in 1995. Since then, several hundred pyroclastic flows or granular avalanches have occurred, some large enough to require the evacuation of half the island. The Montserrat Volcanic Observatory has records of most flows. This is but one example of the crucial need to understand the risk from extreme natural geophysical disasters.
The SAMSI research group that tackled this problem developed a unique methodology for assessing such risks, through a combination of mathematical computer modeling, probability modeling, statistical analysis, and volcanology. Because of the rarity of the extreme disasters, a key component of the analysis was use of TITAN2D, a computer model that allows simulation of pyroclastic flows at a given location (using a digital elevation map and solving the governing hyperbolic PDEs for the thickness and depth averaged velocity of the flowing material). To initialize the computer model, it was necessary to use the available data on volume, V , and direction, Θ , of flows to construct a probability model of the likely flows in the future.
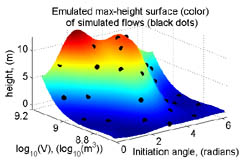
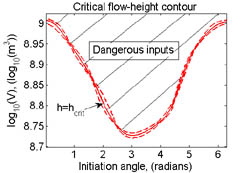
Straightforward simulation of the ensuing risk, utilizing the probability model and TITAN2D, would be doomed to failure because of the enormous time needed to make sufficient runs of the computer model to capture the extreme events. The SAMSI researchers overcame this basic obstacle to use of computer models in risk assessment by an ingenious use of a type of approximation to the computer model called an emulator , which could approximate the maximum height h of flow at a key location (see the left figure below). The emulator could then be used to estimate the critical region defining dangerous flows, and additional computer model runs could be done in this region to refine the emulator. Through this sequential adaptive design process, it was possible to fully characterize the critical flow region (see the right figure below) and ultimately assess the probability of catastrophic damage at the site.
¹Research Group: M.J. Bayarri (Universitat de València); James Berger and Elaine Spiller (SAMSI); Eliza Calder, Keith Dalbey, Abani Patra, and Bruce Pitman (University of Buffalo); Simon Lunagomez and Robert Wolpert (Duke University).