
Traffic Gridlock
In studying traffic flow in a large city grid, the following questions arise. Is there a largest traffic density that permits free flow? Is there a density above which gridlock is inevitable? In 1992 Biham, Middleton and Levine introduced a simplified model for the study of these questions, called the BML model.
This simplified model proved to be surprisingly complex – in a series of papers written over the next dozen years, researchers discovered a remarkable range of traffic behaviour, with a variety of possible outcomes depending on the traffic density. The examples showed a “phase transition”: at sufficiently high densities all vehicles were eventually gridlocked, while at low densities traffic continued to flow. But, despite many attempts, there was no rigorous analysis in place that showed this. At a tea break at MSRI in Spring 2005, during the program on Probability, Agorithms and Statistical Physics, three young researchers, O. Angel, A. E. Holroyd, and J. B. Martin, began a collaboration which resulted in the proof that there is a threshold density for the transition to gridlock.
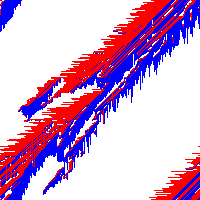
This is the BML model: each intersection of a square grid of streets contains either a red car, a blue car, or an empty space. At each odd-numbered time step, all blue cars simultaneously attempt to move one unit North; a car succeeds if there is already an empty space for it to move into. At each even-numbered time step, the red cars attempt to move East in the same way. A blue car that falls off the North edge of the grid reappears in the same position at the South edge; similarly red cars falling off the East edge reappear on the West edge. Initially, cars are distributed at random: each intersection is independently assigned a car with probability p, or an empty space with probability 1 – p. Each is car is independently equally likely to be red or blue.
|
|
|
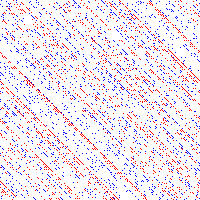
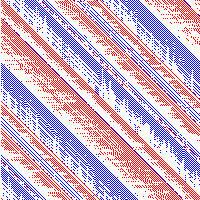
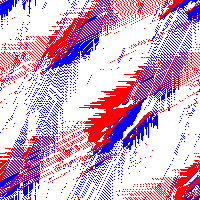
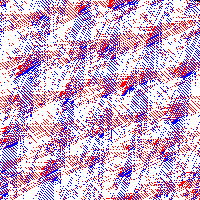
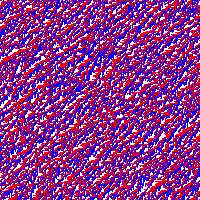
| 10% cars | 30% cars | 32% cars |
|
|
|
| 32% cars | 34% cars | 80% cars |
The accompanying pictures show some of the outcomes after 20,000 steps. For high densities (e.g. 80%, 34% cars), after a while traffic becomes jammed, and no car can move at all. For low densities (e.g. 10%, 30%), after a while traffic is completely free flowing, and no car ever has to wait at all. For these densities, the model appears to exhibit remarkable large-scale organisation; e.g. in the 34% picture there is a single jam spanning the entire grid, while in the 30% picture the cars have arranged themselves into wide diagonal bands that avoid each other. For densities very close to the cutoff, other types of “intermediate” behaviour are seen, as first discovered by Raissa D’Souza, another participant in the program on Probability, Agorithms and Statistical Physics. In the two 32% pictures, all cars move some of the time and wait some of the time, and this is achieved by remarkable semi-regular geometric patterns of jams feeding into each other.
The theorem of Angel, Holroyd and Martin is this. There is a P < 1 such that, on sufficiently large grids, traffic becomes fully jammed when the density of cars p is greater than P. It is an open problem to prove anything about small p, even that traffic is not fully jammed when p is sufficiently small (uniformly in the size of the grid). For more detail, go to to Holroyd’s home page.